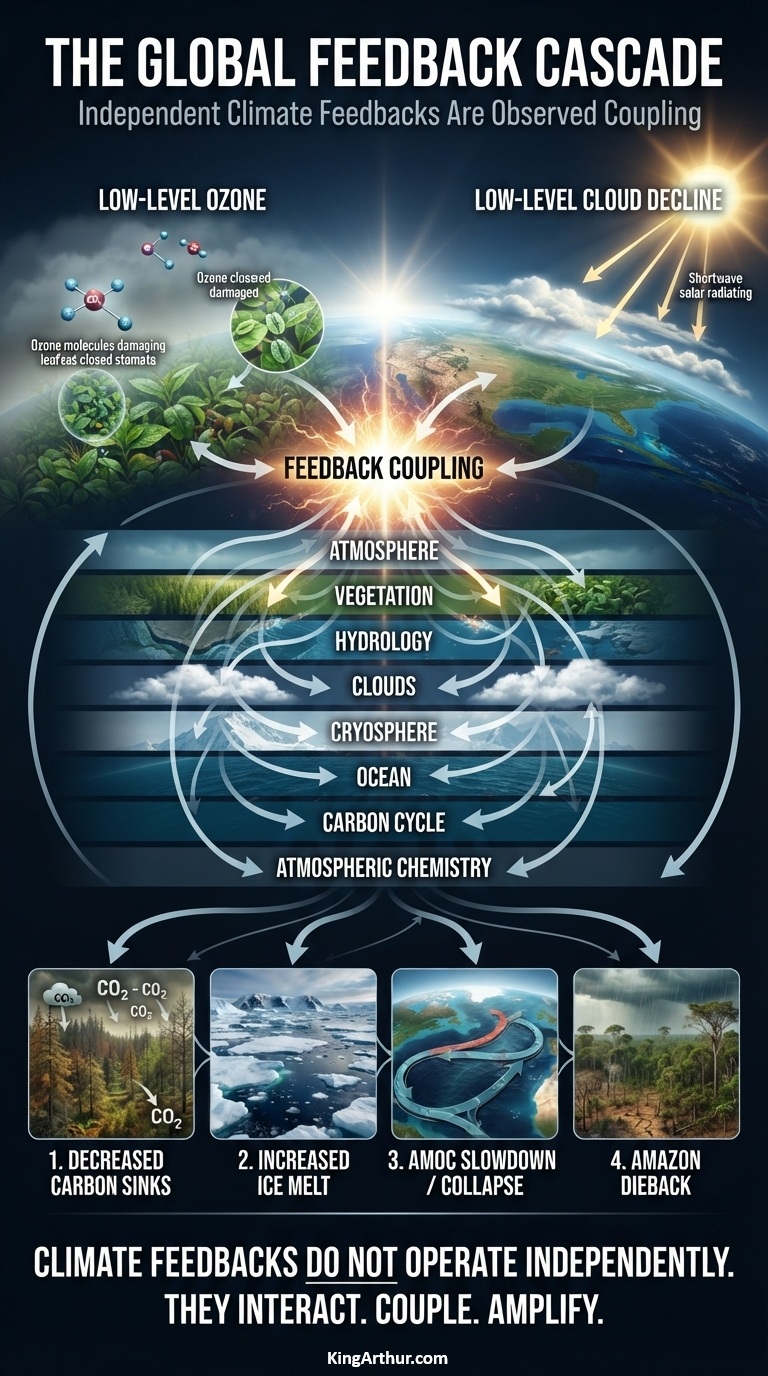
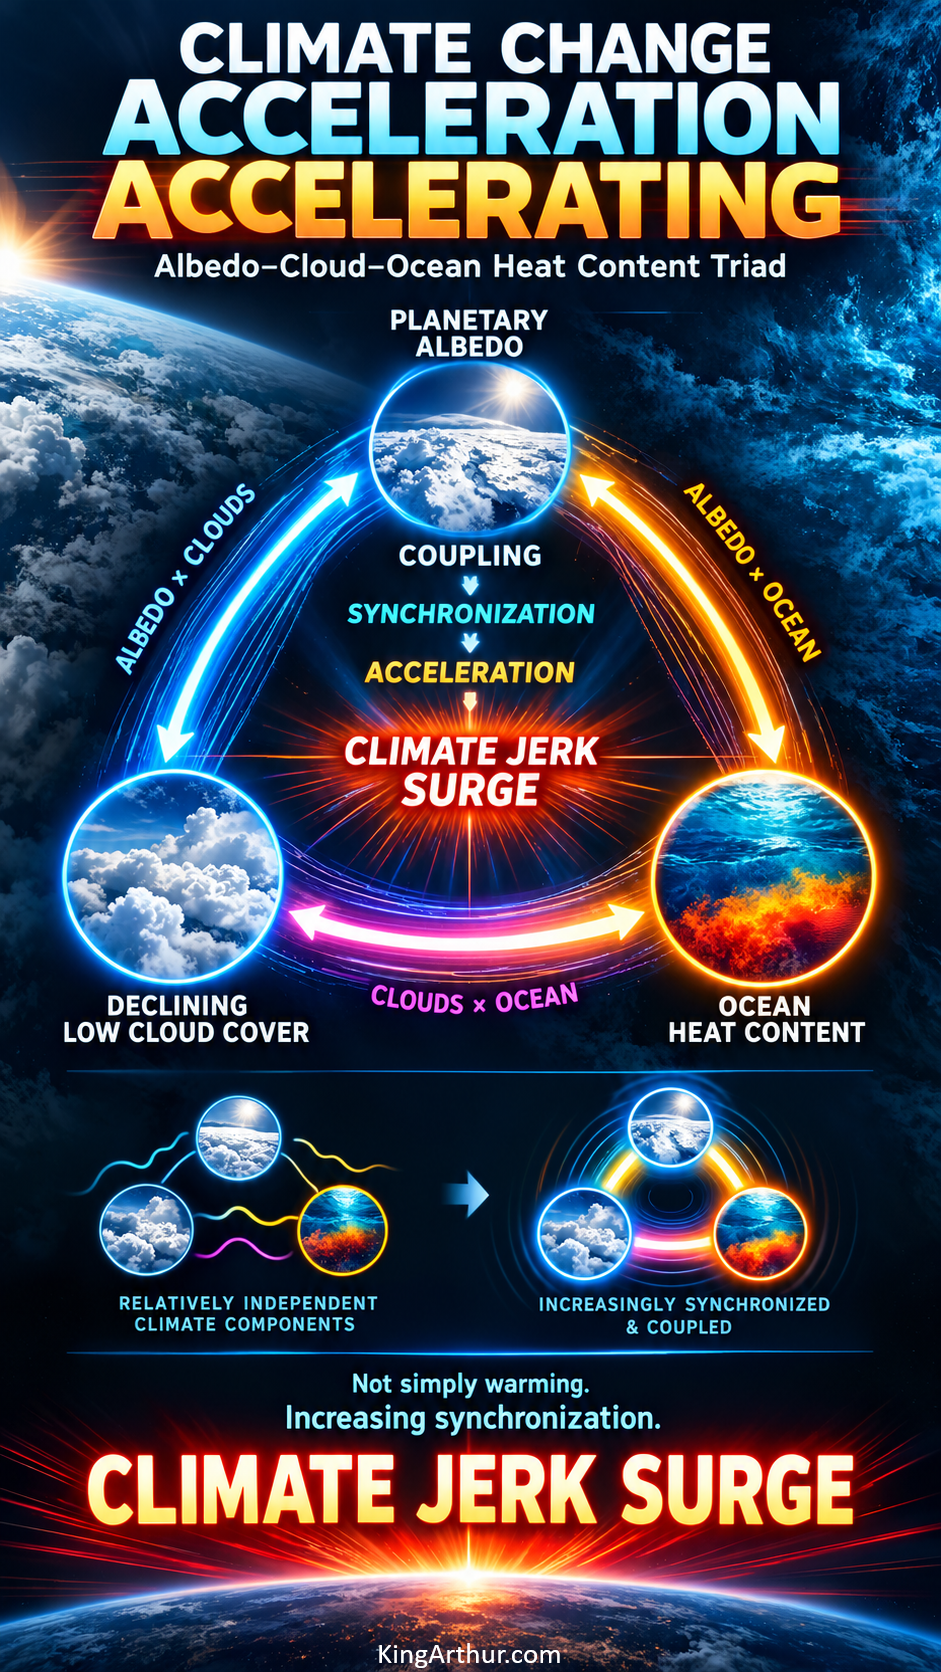
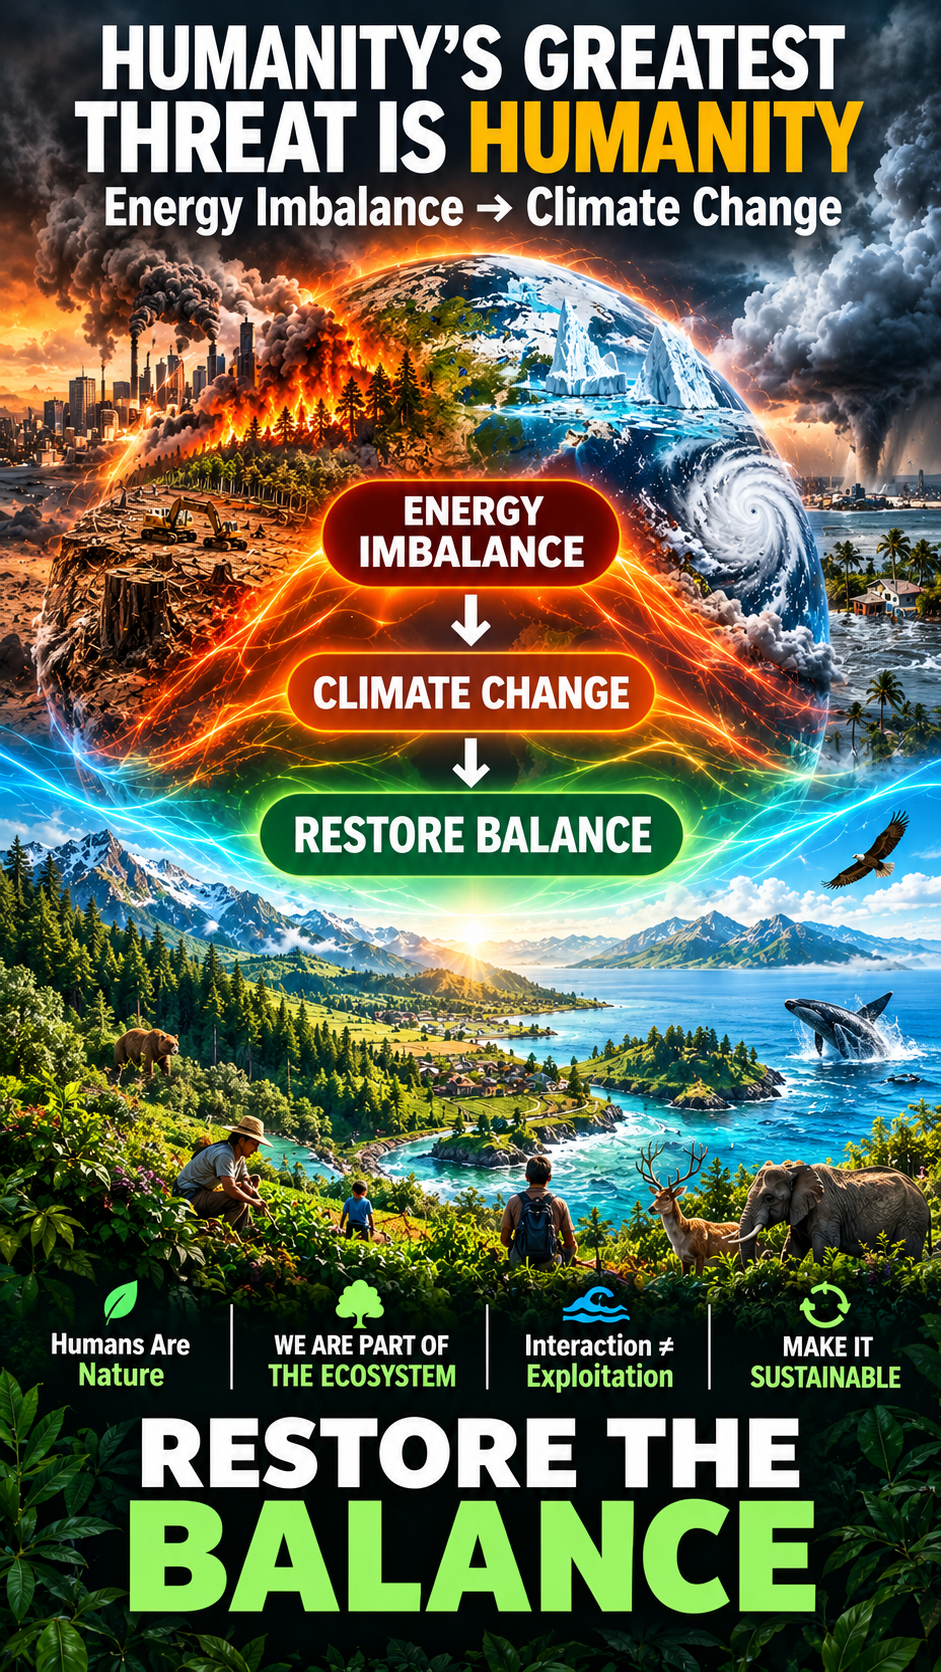
The climate system is not simply warming—it is changing how it responds to that warming. Coupled climate feedbacks are becoming one of the most consequential dimensions of climate risk in the 21st century because they amplify changes and connect individual tipping-point pathways into larger cascading effects.
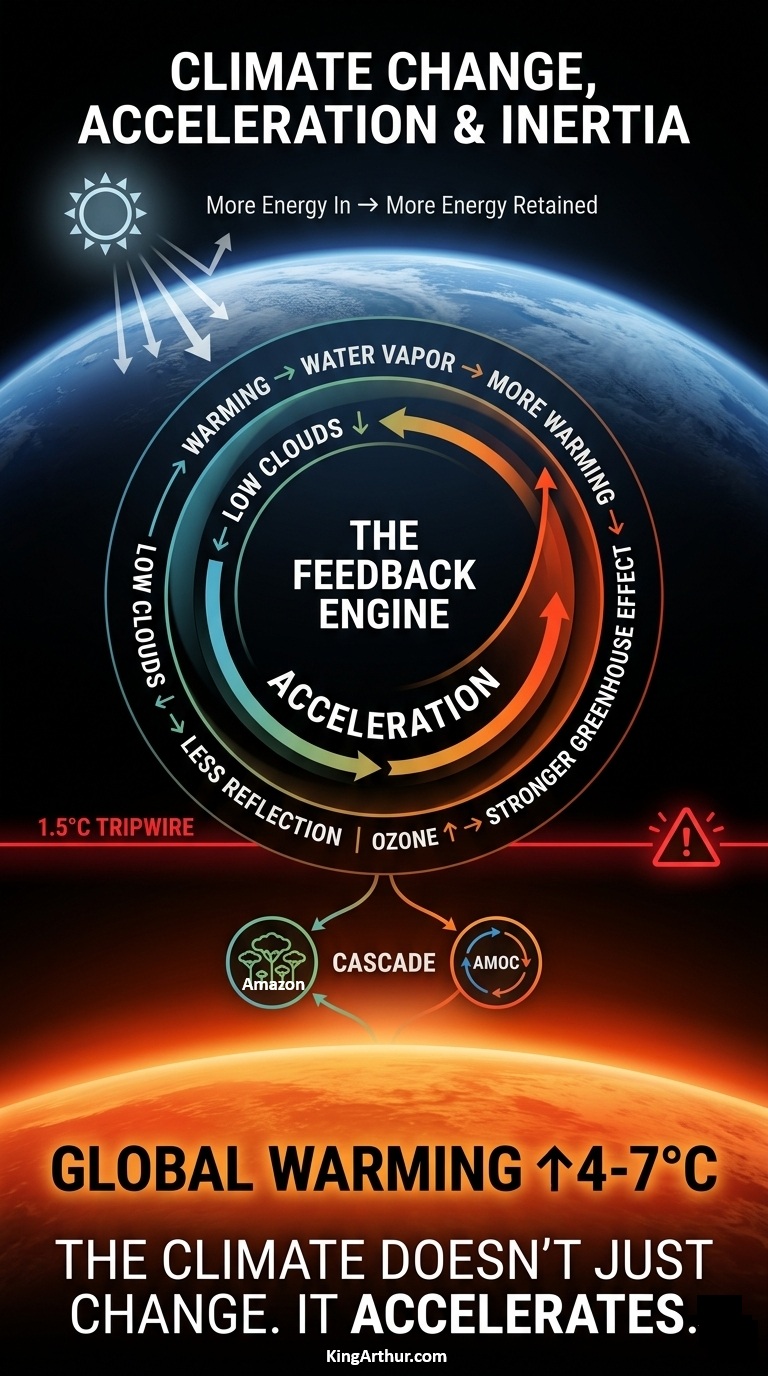
The longer warming persists, the more climate feedbacks become active. As these feedbacks interact, we are already observing nonlinear responses, amplification, and cascading impacts across the climate system. Hundreds of feedback mechanisms have been identified, and many can couple and reinforce one another, contributing to the accelerating pace and increasing magnitude of climate change—The Domino Effect.
Bottom line:The question is no longer how warm the planet becomes, but how life on Earth can endure when change outpaces our ability to adapt. We cannot control the laws of physics, but we can control our pollution. The most effective action is to stop burning fossil fuels.
1Independent Climatologist, Economist, Membrane Institute, USA 2Independent Physicist, Membrane Institute, USA
Overview: Where We Are Today
Climate Change Today: When Weather Becomes Climate is a three-part series designed to simplify where climate science stands today.
Much of the public discussion still focuses on historical trends and older climate models. But since 2023–2024, our understanding of the climate system has advanced significantly as scientists have increasingly examined real-time observations, accelerating changes, feedback loops, and complex Earth system behavior.
The goal of this series is to explain why understanding climate acceleration no longer requires multiple advanced degrees or a deep background in nonlinear chaos theory. The evidence is increasingly visible in the world around us. In many ways, you can begin by simply looking out your window.
Three Irrefutable Lines of Evidence for Human-Caused Climate Change
The strength of the evidence comes from the fact that these observations are connected but independently measurable:
Temperatures are rising. Ice is shrinking. CO₂ is increasing—and its chemical fingerprint identifies a major human source.
The overwhelming convergence of these independent observations makes the central conclusion extraordinarily robust:
Earth is warming, the warming is occurring across the climate system, atmospheric greenhouse gases are rising because of human activity, and the resulting enhanced greenhouse effect is driving the modern warming.
The evidence is not merely suggestive.
It is convergent, measurable, physically explainable, and unmistakably human-driven.
Climate change is often discussed in terms of distant environmental consequences, but for all households, the most immediate effects are increasingly personal and financial.
You may encounter climate change as:
a higher grocery bill, a larger insurance premium, a higher electric bill, a smoky summer afternoon, a longer allergy season, a power outage, a flooded road, a damaged roof, or a greater risk of heat stress.
The most dramatic climate disasters will continue to make the headlines. But the deeper transformation may be quieter: climate change is becoming embedded in the ordinary economics and infrastructure of everyday life.
The question is no longer simply what will climate change do to the planet?
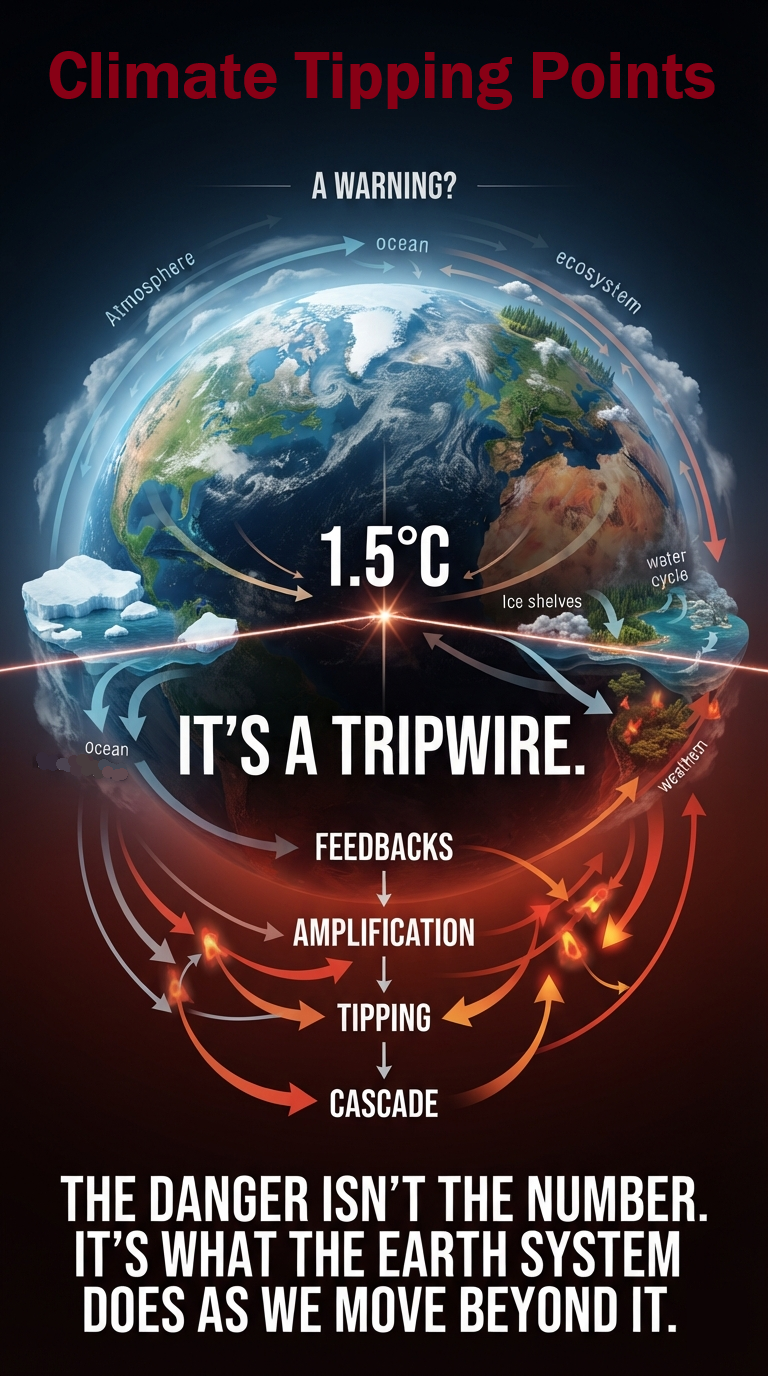
Feedback Loops → Tipping Points → Acceleration → Domino Effect
Feedback loops amplify climate change and can push interconnected Earth systems past critical tipping points. As tipping points are crossed, they can trigger additional feedback loops and destabilize other climate systems. This cascading "Domino Effect" compresses timescales, accelerates change, and increases the risk of rapid, nonlinear climate transformations.
This is what is happening right now. And with every reinforcing feedback we activate, we amplify what comes next.
Polar amplification → weakened equator-to-pole temperature gradients → reduced thermal contrast → atmospheric circulation changes → accelerated Arctic and Greenland ice melt → ICE–ALBEDO FEEDBACK: ice loss → darker surface → greater solar absorption → more warming → more ice loss ↺ → MELT–ELEVATION FEEDBACK: ice loss → lower ice-sheet elevation → warmer air → faster surface melt → further elevation loss ↺ → LAPSE-RATE FEEDBACK: Arctic warming → weaker vertical temperature gradient → reduced atmospheric cooling efficiency → additional near-surface warming → more ice melt ↺ → coupled cryospheric amplification → freshwater input into the North Atlantic → reduced salinity + density → AMOC disruption / potential weakening → North Atlantic pressure-field + storm-track reorganization → greater jet-stream waviness → slower progression → amplified Rossby waves → persistent blocking + omega blocks + meridional flow → stalled atmospheric rivers + prolonged heat domes + drought–flood swings → hydroclimatic whiplash → agriculture + infrastructure + ecosystems + public health stress → PERMAFROST TIPPING ELEMENT: thaw → CO₂ + CH₄ release → additional greenhouse forcing → Arctic warming ↺ → BOREAL FOREST TIPPING ELEMENT: warming + drought + wildfire → forest degradation → reduced carbon uptake + carbon release → additional warming ↺ → AMAZON RAINFOREST TIPPING ELEMENT: warming + drought + fire → reduced evapotranspiration + rainfall recycling → greater drought → forest loss + carbon release → additional warming ↺ → WEST ANTARCTIC ICE-SHEET TIPPING ELEMENT: ice instability → accelerated ice loss → sea-level rise → additional cryospheric stress → global land-ice loss + groundwater redistribution → planetary mass redistribution → altered moment of inertia → rotational dynamics → slight rotational slowing → changes in length of day.
The Entire Climate System Is Changing — And Accelerating
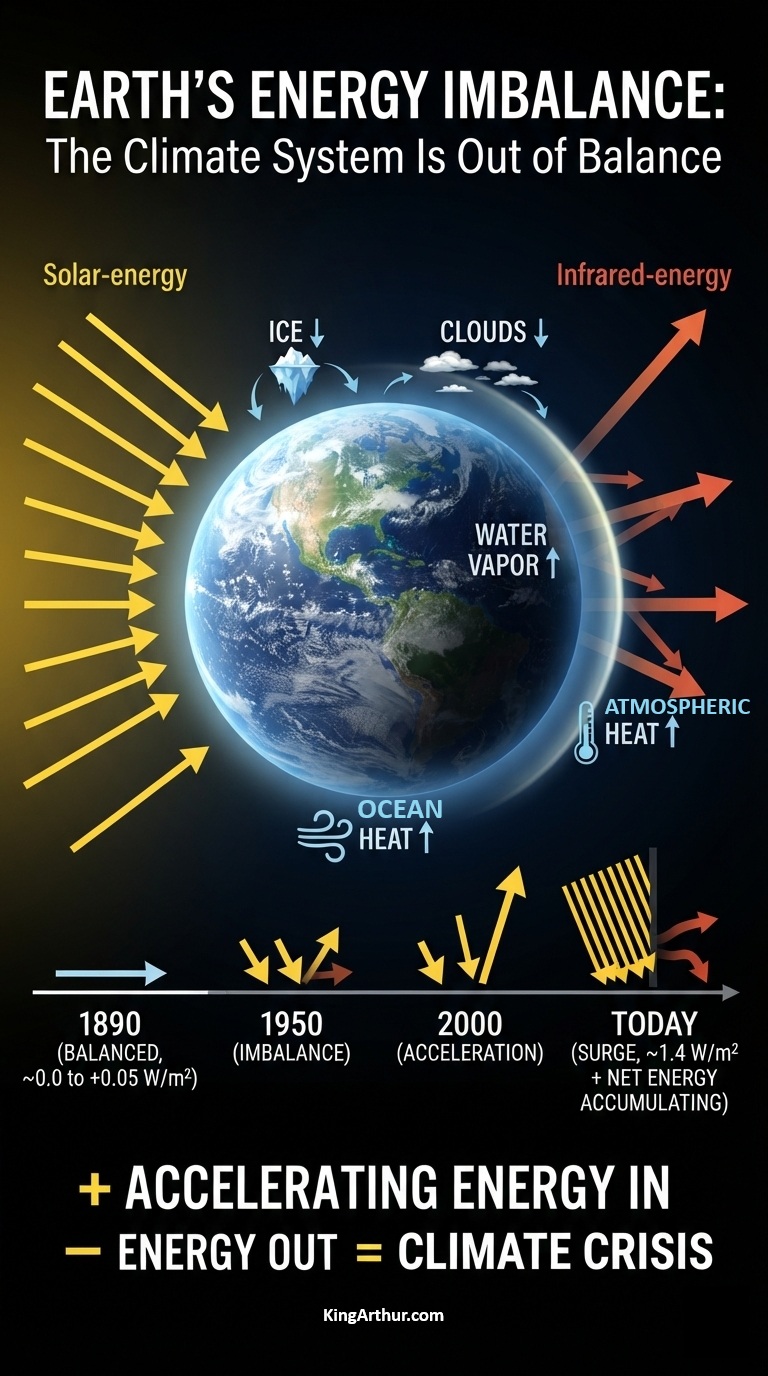
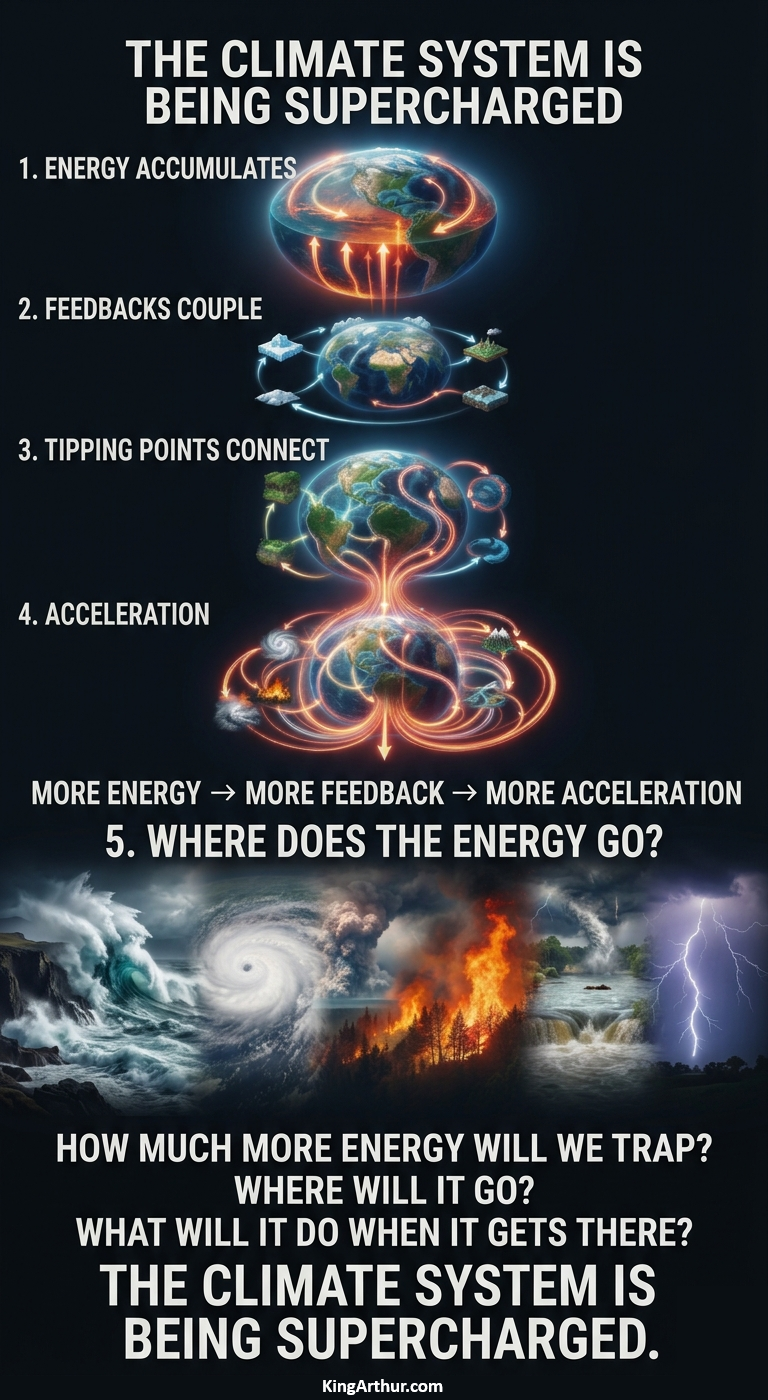
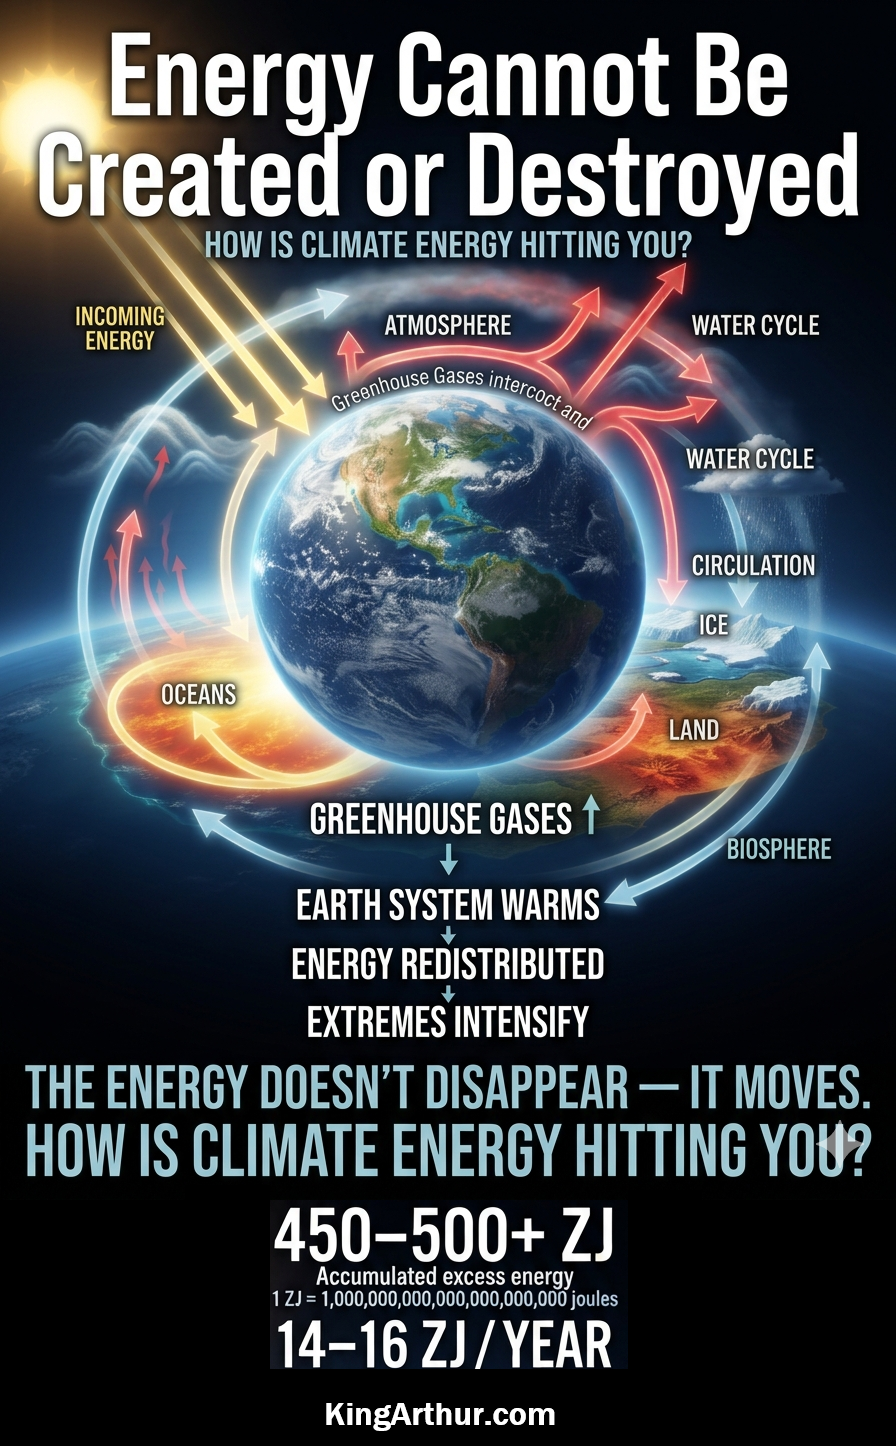
More than 90% of the excess energy accumulated in the climate system is stored in the oceans. The oceans therefore function as the Earth's primary reservoir for the additional thermal energy produced by the increasing concentration of greenhouse gases. This enormous reservoir does not remain isolated, however. Energy is continuously redistributed between the ocean, atmosphere, land, ice, and biosphere through ocean circulation, evaporation, atmospheric circulation, melting and freezing, and exchanges of heat and moisture.
This redistribution of energy is a fundamental reason the probability distribution of climate conditions is becoming increasingly right-tailed and skewed toward more extreme outcomes. As the climate system accumulates additional energy, that energy does not produce a uniform increase across all conditions. Instead, it increases the amount of energy available to drive extremes, pushing the upper tail of the distribution toward increasingly unusual and severe events.
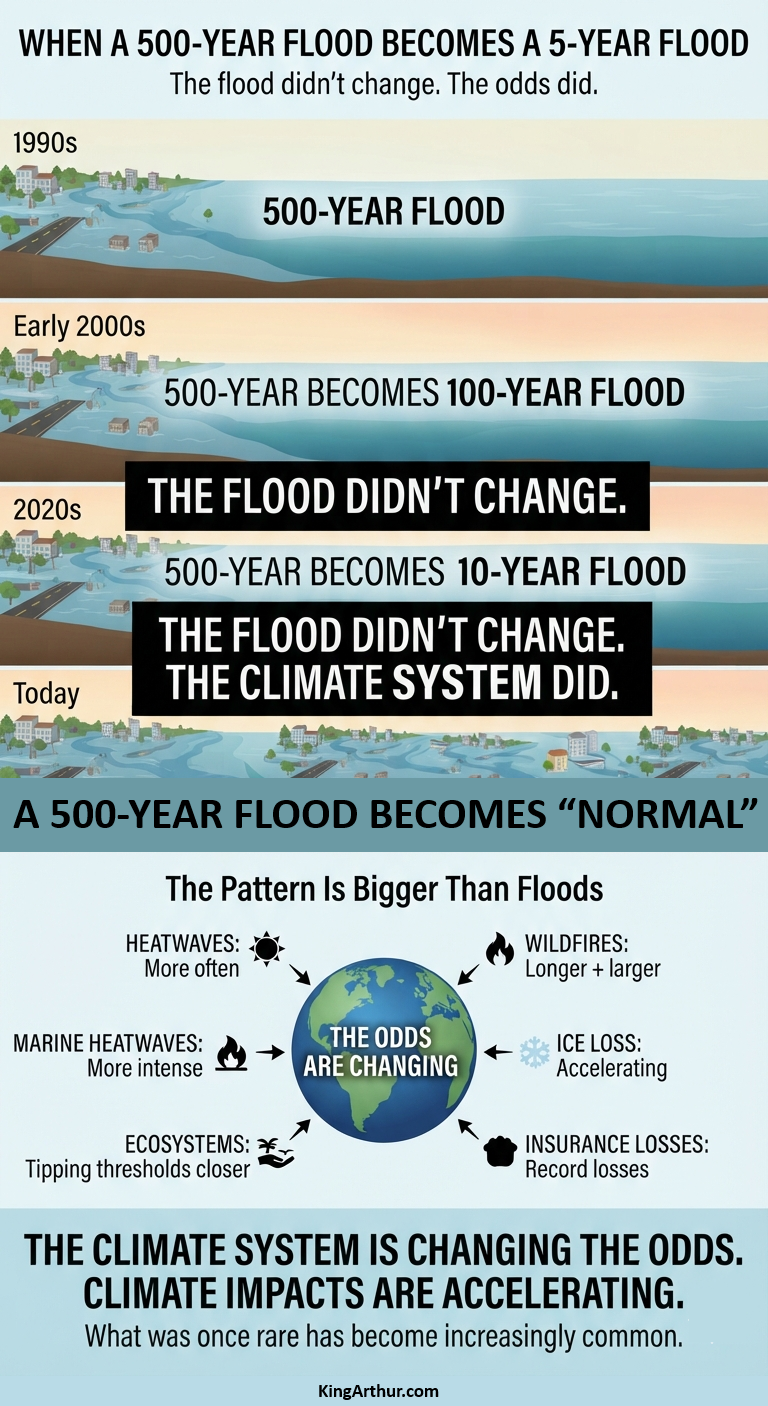
The result is not simply a warmer average climate. The probability of extreme heat, intense precipitation, powerful storms, marine heatwaves, drought, and other high-impact events increases as additional energy moves through the climate system. Some extremes become more frequent, some become more intense, and some persist for longer periods. Events that were once exceptionally rare can therefore become substantially more probable.
The ocean's dominant role in storing excess energy is especially important because it provides a massive and relatively slow-moving reservoir that can continue releasing energy into the atmosphere and interacting with other components of the Earth system over time. The climate system is consequently not responding to greenhouse gas forcing as a simple increase in air temperature. It is undergoing a redistribution of energy across a complex, interconnected system, increasing the likelihood and severity of outcomes in the extreme end of the distribution.
The central message is therefore not simply that the climate is becoming warmer. Rather, the underlying probability distribution itself is changing in ways that make extreme events increasingly likely. Climate events that were once considered exceptionally rare are now occurring with increasing regularity, persisting for longer durations, and producing greater human, ecological, and economic damage.
Perhaps most importantly, these extreme events are no longer acting independently—they are increasingly feeding one another through interconnected feedback loops. As the Earth's energy imbalance grows, the frequency and intensity of feedback coupling also increase. Heat fuels evaporation, evaporation intensifies atmospheric rivers, warmer oceans provide additional energy for tropical cyclones, persistent high-pressure systems strengthen heat domes, and greater atmospheric instability produces more powerful thunderstorms and lightning. These are all manifestations of the same excess thermal energy being redistributed throughout the Earth system. While the planetary energy imbalance itself is an abstract concept, these increasingly energetic transfers of heat into real-world weather extremes are phenomena that people can directly observe and experience. In that sense, atmospheric rivers, heat domes, severe thunderstorms, and lightning provide some of the clearest illustrations of how excess thermal energy is reshaping our climate.
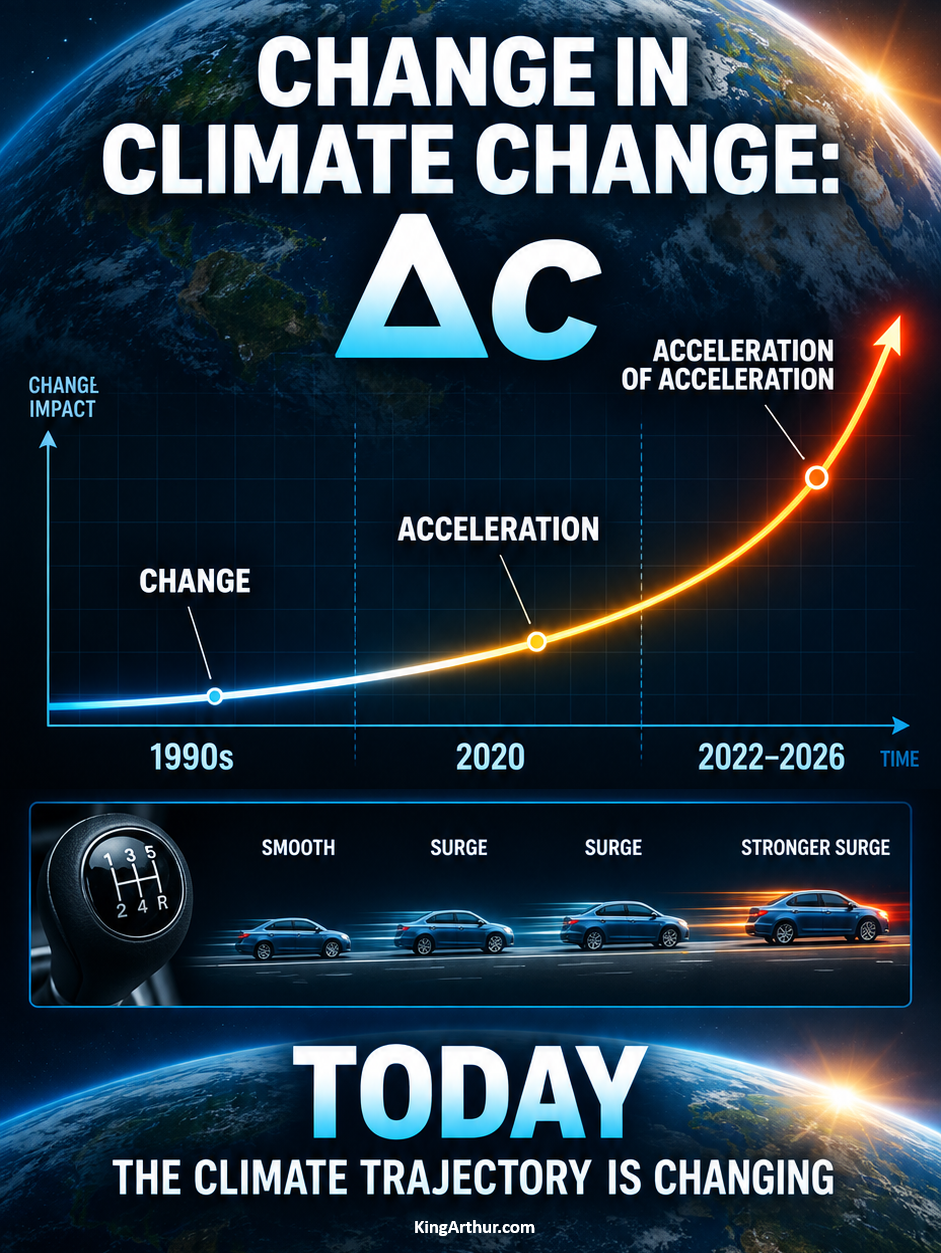
From the Industrial Revolution through the 1990s, key climate-acceleration indicators appear to have doubled on timescales closer to a century. By 2023, many major warming-related impacts are doubling on timescales closer to a decade.
In effect, the leading indicators suggest a multi-stage compression of characteristic doubling times, consistent with approximately six successive halving steps (2^6) when comparing early industrial-era timescales with recent decade-scale behavior across multiple indicators. This represents a heuristic description of cumulative nonlinear compression rather than a single-step ratio, and reflects the aggregation of changes across multiple time intervals and Earth-system variables.
By 2025, analysis could move beyond purely retrospective exponential fitting toward a state-space formulation of system evolution. The Earth's climate system is undergoing a regime shift away from historically near-linear behavior toward accelerating nonlinear and compounding dynamics, characterized by systematically shrinking effective doubling times and the emergence of instantaneous-growth dynamics across coupled Earth system components.
Multiple climate indicators now point to rates of warming-related disruption far beyond those observed during the modern instrumental era.
There is no well-established geological analog for a sustained, multi-variable, decade-scale pattern of accelerating change across the full Earth system at the resolution available in contemporary observations. If sustained, this may represent one of the most abrupt large-scale climate transitions in Earth’s geological history.
The Collapse of Climate Predictability
Many of the climate indicators traditionally used for forecasting are exhibiting increasingly nonlinear and volatile behavior. Temperature anomalies, ocean heat content, sea-level rise, atmospheric moisture, ice loss, and extreme weather patterns are showing changes that are becoming more difficult to model using assumptions based primarily on historical variability.
For much of the modern scientific era, Earth’s major climate oscillations were studied as largely independent systems. Phenomena such as the El Niño–Southern Oscillation (ENSO), the Atlantic Meridional Overturning Circulation (AMOC), the Arctic Oscillation (AO), the Pacific Decadal Oscillation (PDO), the Indian Ocean Dipole (IOD), and the Atlantic Niño/Niña each possessed recognizable patterns, historical relationships, and reasonably predictable behavior.
Today, however, a growing body of observations suggests these systems are becoming increasingly interconnected through shared reservoirs of heat, moisture, ice, and atmospheric circulation. Rather than behaving as isolated oscillators, they are evolving into a tightly coupled network in which disturbances propagate across multiple components of the Earth system. This increasing connectivity reduces the reliability of historical climate relationships and contributes to what can be described as the collapse of climate predictability.
The shifting and expanding right tail of the probability distribution illustrates what is already being observed in the real world. As the climate warms, the entire distribution moves toward more extreme outcomes while the likelihood of high-impact events increases disproportionately.
Sidd explains GCMs:
General Circulation Models (GCMs) of Earth's climate are nonlinear and highly teleconnected. That
means a small change in temperature or pressure or humidity in one small area on
the globe can cause _large_ changes in conditions _anywhere_ on the globe. This phenomenon is often referred to as the Butterfly Effect -- the idea that a butterfly flapping its wings in China could ultimately contribute to a hurricane forming in the Atlantic. The complexity of these models can lead to
chaotic behavior. Climate science must grapple with these models and extract
results in spite of the mathematical difficulties, and there have been remarkable
successes in some cases and sad failures in others. Nevertheless we must proceed.
Because Earth's climate is a chaotic, nonlinear system, long-term projections rely on ensemble modeling rather than deterministic forecasts. Statistical mechanics and chaos theory provide the framework for evaluating plausible future states. In a probabilistic, ensemble-based climate model, overlapping scenarios are expected. Individual trajectories may diverge, converge, or overlap as nonlinear feedbacks evolve. Some feedbacks accelerate over time, some exhibit accelerating acceleration, and many contain both reinforcing (positive) and stabilizing (negative) components whose relative influence changes as the climate system evolves.
At the beginning of a forecast, many ensemble members are nearly identical, so they overlap almost completely.
As time progresses, internal variability and nonlinear dynamics cause the trajectories to diverge.
Some trajectories may later converge again if they respond similarly to a common forcing or system constraint.
Unlike linear uncertainty envelopes, nonlinear ensemble fans are dynamic. Individual trajectories may overlap because each simulation experiences a different sequence and magnitude of interacting feedbacks. Some feedbacks are accelerating, while others exhibit accelerating acceleration as tipping elements become increasingly coupled. Many feedbacks also contain both positive and negative components, with their relative strengths evolving over time. As these competing processes shift, trajectories can converge, diverge, cross one another, or bifurcate into new system states. The resulting fan is therefore not a simple widening cone of uncertainty but a dynamic probability landscape reflecting the evolving physics of the Earth system.
Projected Temperature Ranges by 2100-2200
Rapid decarbonization / low-emissions pathway: Approximately ~2–4°C warming Represents an increasingly difficult pathway to achieve and would require immediate, sustained, and large-scale global emissions reductions.
Current policy trajectory: Approximately ~3–7°C warming Reflects scenarios where emissions plateau or decline slowly without deep structural reductions.
High-feedback / tipping cascade scenario:
Approximately ~5–9°C warming
Represents an increasingly likely high-risk pathway in which nonlinear climate feedbacks, weakening carbon sinks, ecosystem collapse, permafrost thaw, large-scale wildfire emissions, and interacting tipping elements amplify warming well beyond direct human emissions alone. The upper range is constrained by the laws of physics, not by arbitrary model limits.
The greatest uncertainty is no longer whether climate change will occur, but how strongly Earth’s own feedback systems will accelerate it now critical thresholds are crossed.
Earth System Response Regimes
Linear physics: ~3–5°C
Full feedback participation: ~6–9°C plausible
Runaway transition: >10°C over centuries (Hothouse pathway)
Risk Interpretation
Most likely outcome under current policy: 3–7°C warming this century.
How should we measure humanity’s true climate footprint?
Traditional emissions accounting focuses on where carbon is released,
but globalization has separated production from consumption. A more complete picture
requires understanding both who produces emissions and
who ultimately drives demand.
This analysis compares two complementary approaches:
🌍 The True Climate Footprint (PCTC)
Measures total climate responsibility by including:
Consumption-based emissions
Land-use change and deforestation
Fossil fuel extraction
Methane leakage and flaring
International shipping and aviation
All major greenhouse gases
🛒 The Carbon We Own
Examines the emissions required to support modern lifestyles, including:
Household energy use
Imported goods and supply chains
Public and private services
Transportation
Consumption patterns
Together, these frameworks provide a more complete view of climate responsibility
than either approach alone.
The question is no longer just:
“Where were emissions created?”
It is also:
“Who benefits from them, who drives demand, and who owns the responsibility?”
Climate change represents one of the largest transfers of wealth and economic risk in human history. The impacts are not limited to environmental damage; they are increasingly reshaping personal finances, investment strategies, real estate markets, insurance availability, government budgets, and the broader economy.
As climate risks accelerate, traditional approaches to financial planning must evolve. The value of homes, businesses, retirement assets, and investments will increasingly depend on exposure to physical risks such as flooding, extreme heat, wildfire, storms, and water scarcity, as well as transition risks associated with changing regulations, energy markets, and consumer behavior.
Understanding financial planning, real estate markets, estate planning, risk management, and the fundamentals of economics, monetary policy, and fiscal policy has never been more important. Individuals, families, businesses, and governments must adapt to a rapidly changing economic landscape where climate risk becomes an increasingly important factor in preserving capital, maintaining financial security, and building long-term wealth.
The goal is not to predict an immediate economic collapse, but to recognize that climate change is creating a gradual restructuring of economic value. Those who understand these emerging risks and incorporate them into their financial decisions will be better positioned to protect assets, manage uncertainty, and take advantage of new opportunities in the decades ahead.
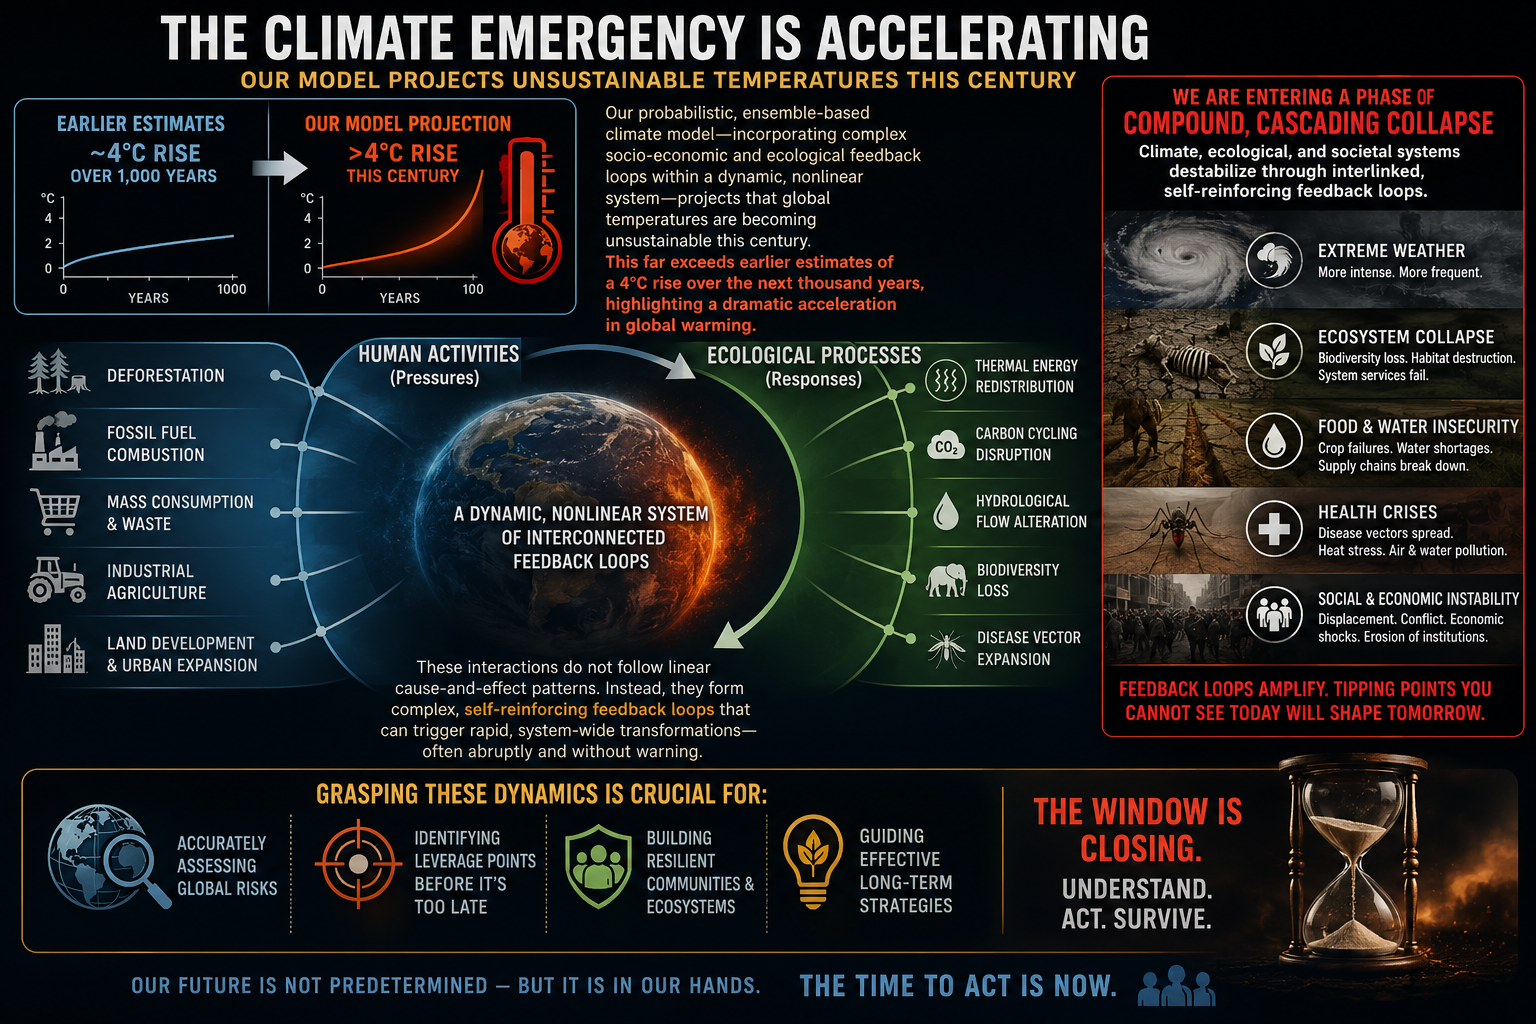
We examine how human activities — such as deforestation, fossil fuel combustion, mass consumption, industrial agriculture, and land development — interact with ecological processes like thermal energy redistribution, carbon cycling, hydrological flow, biodiversity loss, and the spread of disease vectors. These interactions do not follow linear cause-and-effect patterns. Instead, they form complex, self-reinforcing feedback loops that can trigger rapid, system-wide transformations — often abruptly and without warning. Grasping these dynamics is crucial for accurately assessing global risks and developing effective strategies for long-term survival.
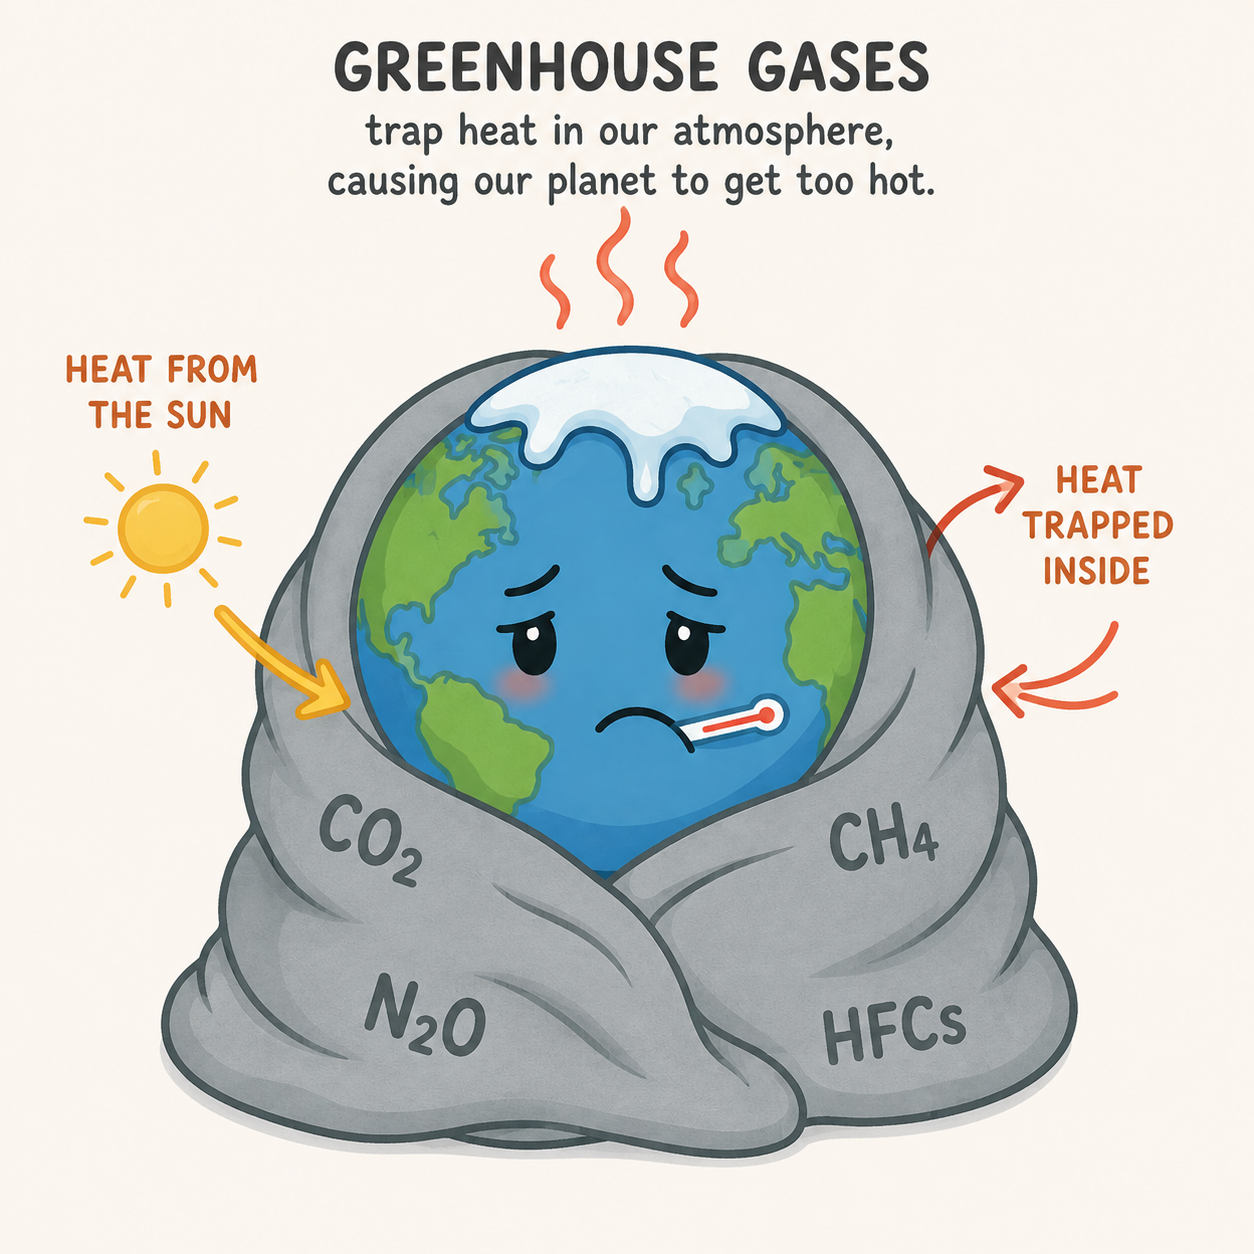
Feedback Loops → Tipping Points → Acceleration → Domino Effect
Feedback loops amplify climate change and can push interconnected Earth systems past critical tipping points. As tipping points are crossed, they can trigger additional feedback loops and destabilize other climate systems. This cascading "Domino Effect" compresses timescales, accelerates change, and increases the risk of rapid, nonlinear climate transformations.